Data Analysis
The process of inspecting, cleaning, transforming, and modeling data in order to discover useful information, draw conclusions, and support decision-making.
The process of inspecting, cleaning, transforming, and modeling data in order to discover useful information, draw conclusions, and support decision-making.
Data analysis refers to the process of inspecting, cleaning, transforming, and modeling data in order to discover useful information, draw conclusions, and support decision-making. It involves applying various statistical and computational techniques to extract insights from the data and uncover patterns, relationships, and trends. Here are the general steps involved in data analysis:
Remember that data analysis is an iterative process, and you may need to revisit earlier steps as you gain new insights or encounter new challenges during the analysis. It is important to use sound statistical and analytical techniques, apply appropriate data visualization methods, and critically evaluate the results to ensure the reliability and validity of your analysis. 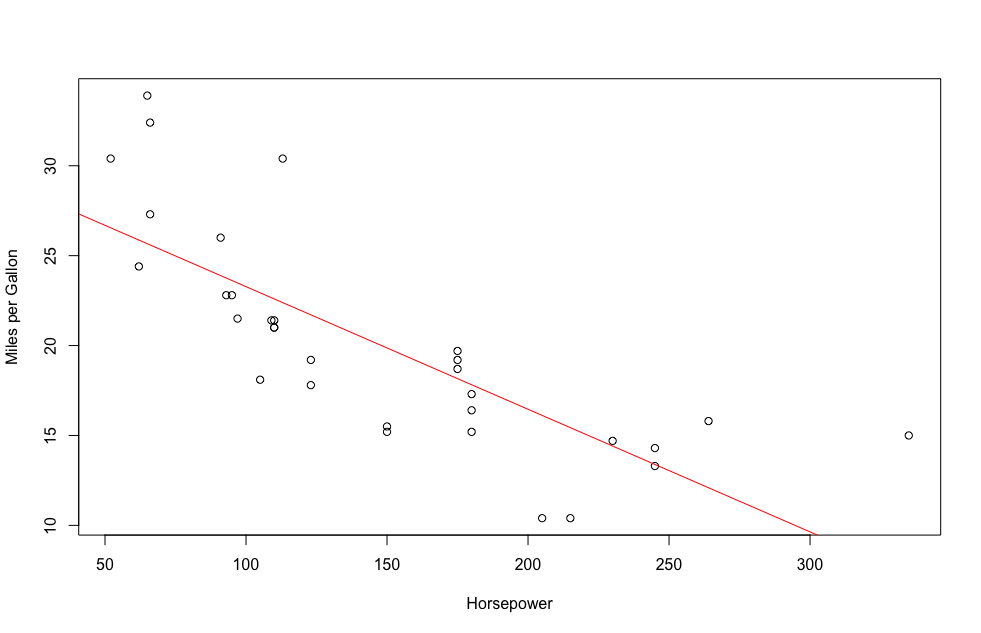 Generate plot for mpg dataset by ggplot2:
  Learn More About Data Visualization Code in R
# Step 1: Data Collection (Built-in dataset)
data(mtcars)

# Step 2: Data Cleaning # Check for missing values
sum(is.na(mtcars))

# Step 3: Exploratory Data Analysis (EDA) # Summary statistics
summary(mtcars)

# Scatter plot of mpg vs. horsepower
plot(mtcars$hp, mtcars$mpg, xlab = "Horsepower", ylab = "Miles per Gallon")

# Step 4: Data Preprocessing # Feature scaling (scaling variables to have zero mean and unit variance)
scaled_data <- scale(mtcars)

# Step 5: Statistical Analysis # Perform a t-test to compare mpg between automatic and manual cars
t.test(mpg ~ am, data = mtcars)

# Step 6: Machine Learning (Linear Regression) # Train a linear regression model to predict mpg based on horsepower
model <- lm(mpg ~ hp, data = mtcars)

# Step 7: Data Visualization # Scatter plot with regression line
plot(mtcars$hp, mtcars$mpg, xlab = "Horsepower", ylab = "Miles per Gallon")
abline(model, col = "red")

# Step 8: Interpretation and Conclusion # Coefficients of the linear regression model
coefficients(model)

# Step 9: Documentation and Reporting # Create a report or presentation summarizing the analysis process and results